
Features /
Process architecture
Visualize every connection across your organization
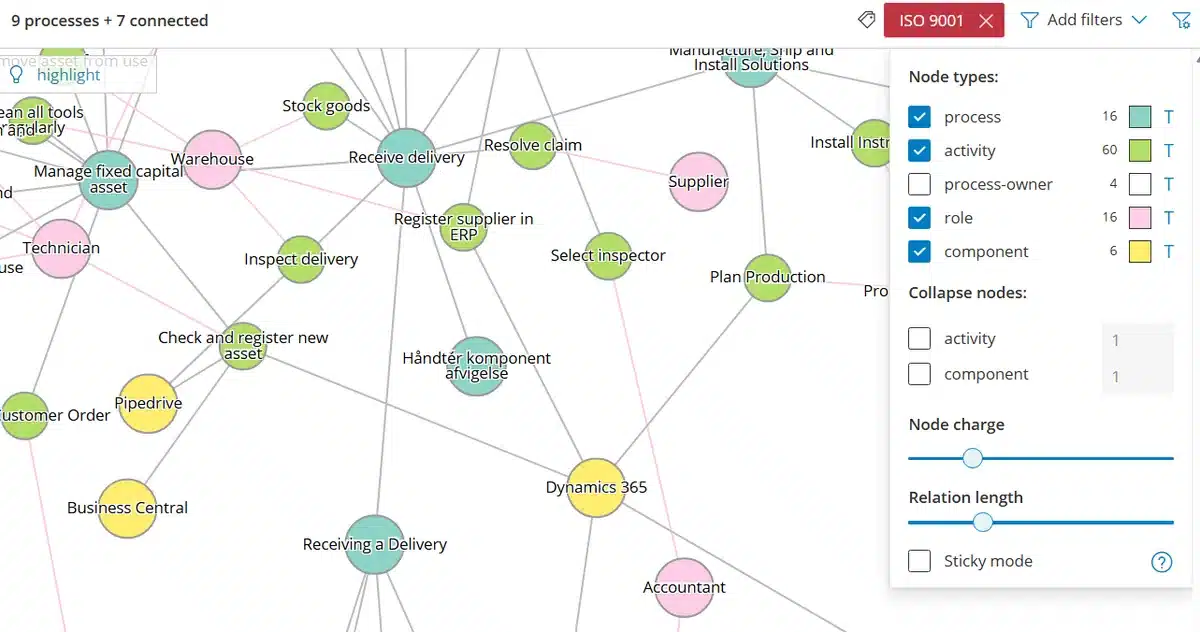
Gluu Explorer shows visual process connections across your account: every Process, Activity, Role, and system Component as a live, connected graph, drawn straight from Gluu’s own graph database. Put any one of them at the center and see everything it touches in real time — from a single activity to every system an ERP upgrade would change.
 All nine node types — process to component
Draws live from your account — nothing to keep updated by hand
What it is
Gluu stores every Process, Activity, Role, User, and Component as a node in one graph, with the relationships between them — role assignments, upstream and downstream process chains, and where a system Component is used — kept as edges on that same graph. The Explorer is the interactive view of it: an account-level view of every connection at once, or a scoped view opened from a single process or activity to see just its neighborhood.
It’s one more way of navigating the same structure your account is already built on — the hierarchy for levels and ownership, the Explorer for how everything connects.
Why it matters
Why map process relationships as a graph?

See what an ERP change actually touches
Before you touch a shared system, click that Component in the Explorer and see every Activity, across every Process, that depends on it — instantly, not after asking around. It’s the fastest way to answer “what does this ERP upgrade actually affect?” before you schedule it.

Enterprise architecture grounded in real work
Classic enterprise architecture tools model the business top-down, then have to be kept in sync by hand. The Explorer instead reflects the Processes, Roles and systems mapped in Gluu today, so what you see is grounded in how the business actually runs — a useful supplement to your existing EA tooling, not a rebuild of it.

No separate mapping project required
The Explorer draws its graph from the Processes, Activities, Roles and Components already mapped in Gluu — there is no separate architecture-mapping exercise to commission or spreadsheet to export before you get a connections view.
How it works
How does Explorer show process connections in Gluu?
There is nothing to draw or maintain — the graph is generated from the Processes, Activities, Roles and Components already in your account. Step-by-step instructions live in the guide to exploring asset connections.
1. See every connection at once
Open the Explorer for a full account view: every Process, Activity, Role, owner and Component shown as a node, filtered by type and searchable by name — a helicopter view of everything at once, not just a single page or filter result.
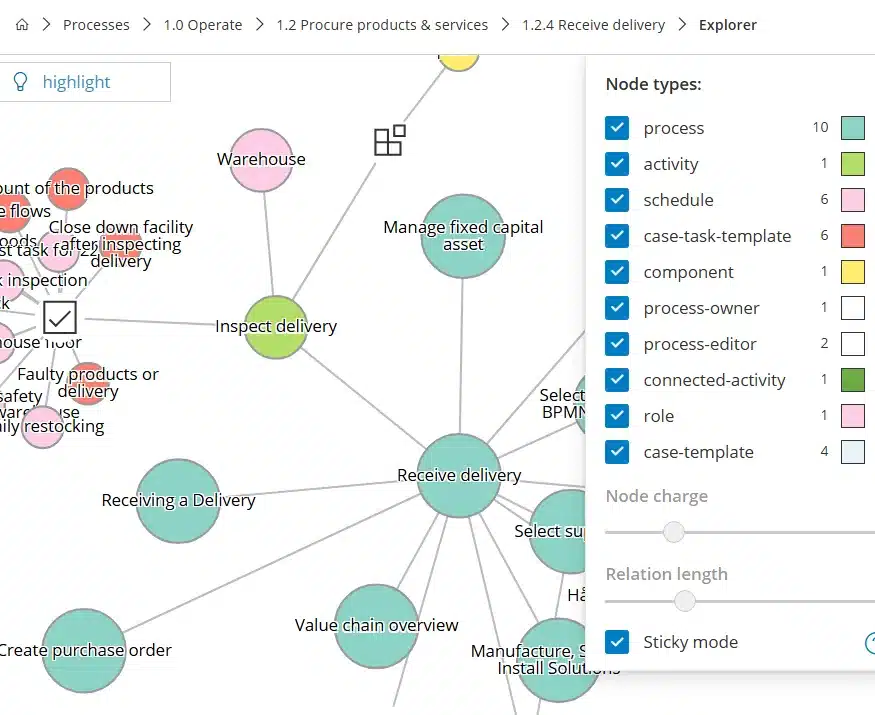
2. Or start from one process or activity
Open the Explorer from a single process or activity page instead, and it pre-selects that item as the center. Useful right before you edit a work instruction and need to know everywhere else it’s reused.
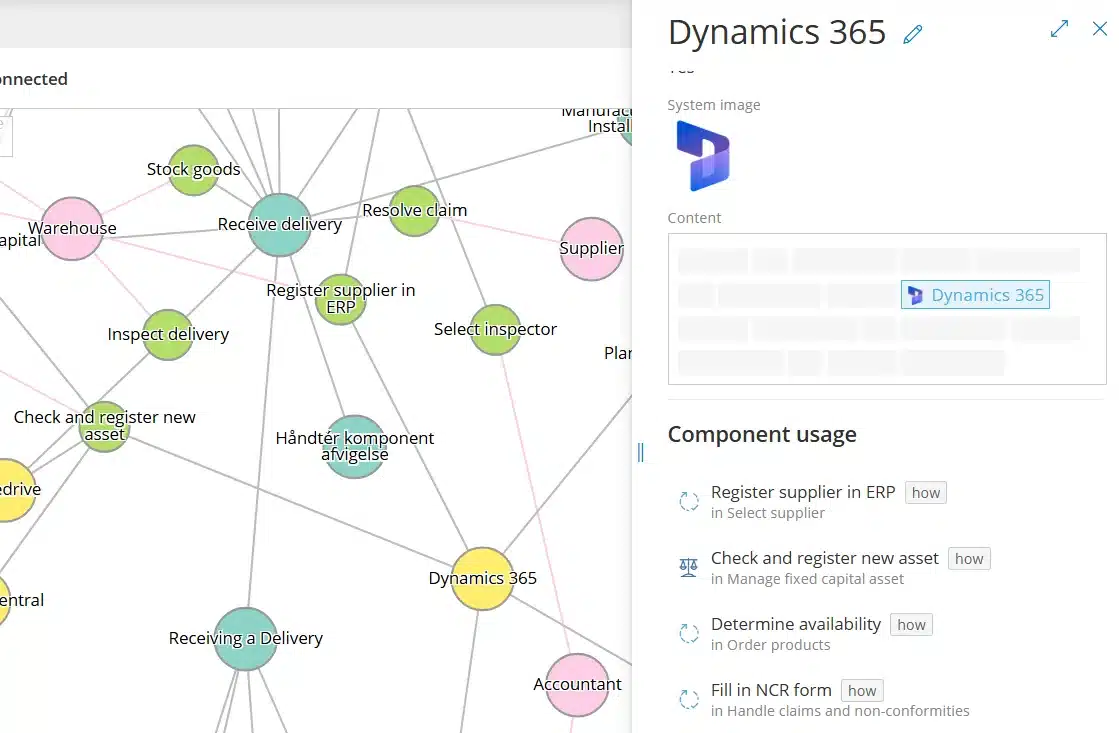
3. Click any node to see what’s behind it
Click a Component like an ERP or CRM system and see every Activity, across every Process, that depends on it — with a direct link into how each one uses it. Useful live, in a workshop, the moment someone asks “where else does this show up?”
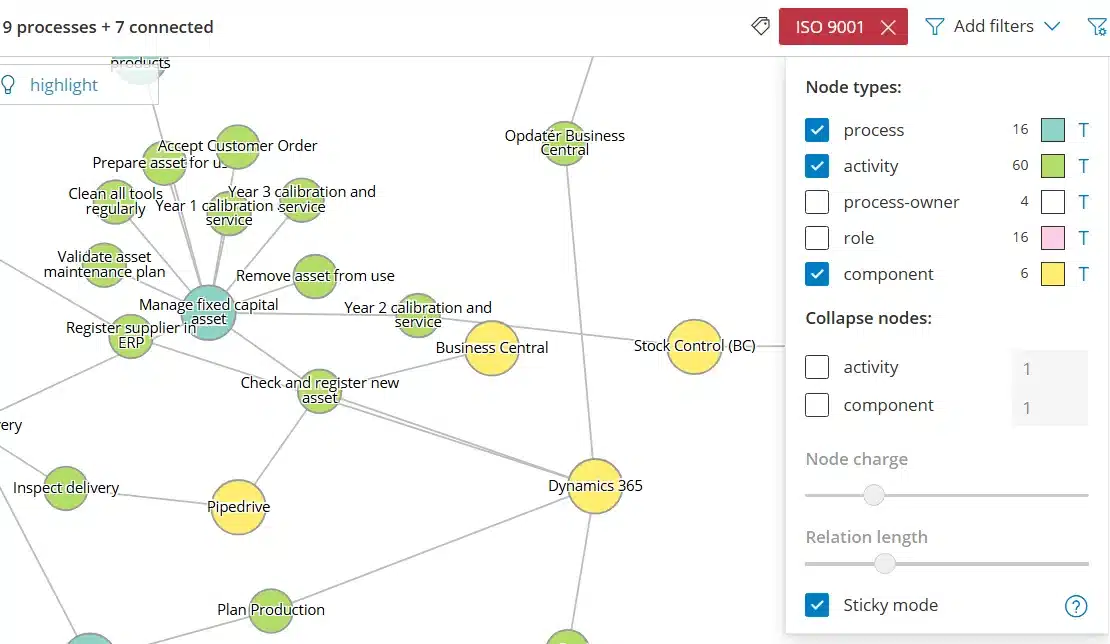
4. Filter, pin, and present the result
Filter by node type or label, adjust node charge and relation length to declutter a dense cluster, and switch on sticky mode to freeze the layout — turning the live graph into something you can present to a room instead of just explore alone.
Availability
The Explorer requires the Business Architecture add-on and is available on the Essential and Advanced plans — it is not included in Core. Filtering by Component to see where a specific system is used, as in the example above, needs the Advanced plan as well. See what each plan includes on the pricing page.
Frequently asked questions
The Explorer requires the Enterprise Architecture add-on. It isn’t included in the Core, Essential, or Advanced base plans on their own — the add-on is available for both Essential and Advanced accounts. See what each plan includes on the pricing page.
The account-level view is a full graph of every connection in your account — a helicopter view you explore by filtering, zooming, and dragging. Opening the Explorer from a specific process or activity page instead pre-selects that item as the starting point, useful right before you edit a work instruction and need to know where else it’s used.
Yes. Filtering the Explorer by Component — to see every Activity that depends on a given system — requires the Advanced plan, since Components themselves aren’t available on Core or Essential.
Yes. Clicking a node re-centers the graph on it, and sticky mode freezes the layout so you can drag nodes into a clearer arrangement — useful for walking a room through a set of connections instead of exploring alone beforehand.
Not on its own. The Explorer doesn’t produce capability maps or architecture roadmaps — it gives you a connections view grounded in the Processes, Roles, and systems already mapped in Gluu, which is a useful complement to a dedicated EA tool rather than a replacement for one.
Nine: process, activity, schedule, case-task-template, component, process-owner, process-editor, connected-activity, and role — each shown as a differently colored node, and each filterable on or off.
Written and reviewed by
Last updated
All Features
Keep exploring the platform
Ready to see how it all connects?
Gluu free 30-day trial. No credit card required. Start from €24 / year.