Process mapping

Process mapping — sometimes called business process mapping — turns “how work must be done” into something everyone can see, discuss, and improve. When you visualize a work flow end-to-end, you spot bottlenecks, unclear handoffs, and duplicate effort much faster. In this guide, you’ll learn what process mapping is, the five basic process mapping symbols, how L1–L4 process levels organise information, which process mapping tools to consider, and how to build maps that actually get used—plus practical process mapping examples you can copy.
Let’s start with defining it.
What is process mapping?
Process mapping is the practice of creating a visual representation of a process — a diagram that shows the steps, decisions, inputs, outputs, and roles involved in getting work done, from the first trigger to the final outcome. It is also called business process mapping when the focus is a business workflow.
Because the map makes work visible, it helps teams identify:
- Bottlenecks where tasks pile up
- Redundancies where steps repeat or add little value
- Handoffs where work gets stuck between teams
- Control points such as approvals and checks
- Root causes behind errors and rework
Just as importantly, process mapping improves shared understanding. People often describe the same workflow in different ways. A map creates a single agreed version of “the way we work today,” or “standard work”, which is the starting point for improving “the way we want to work tomorrow.”
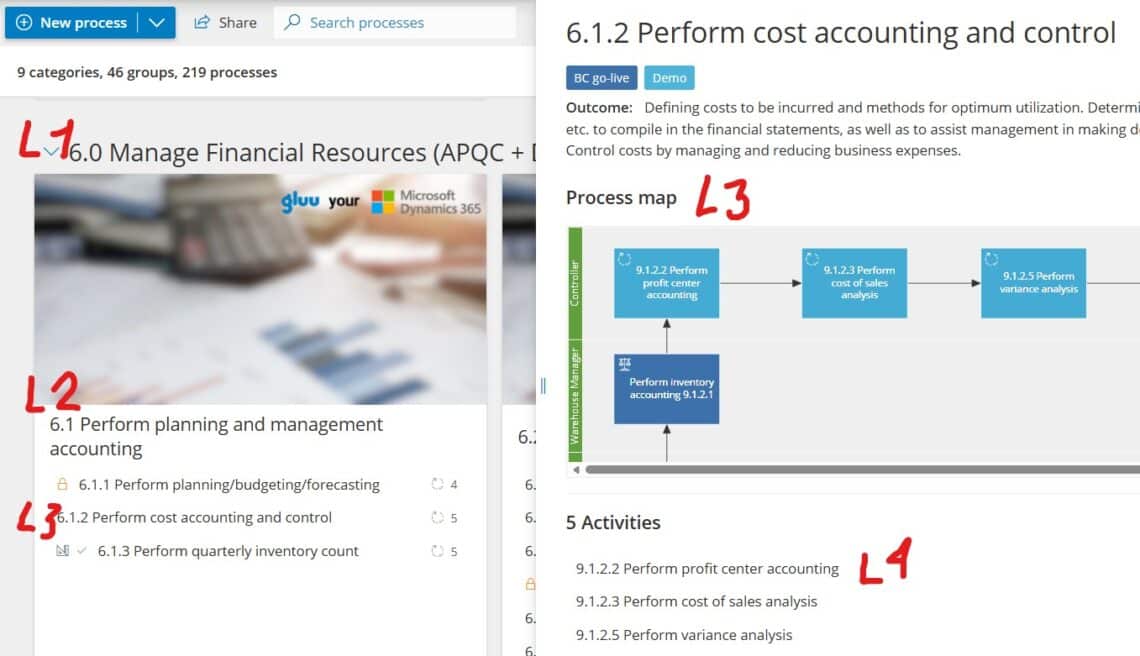
L1, L2, L3, and L4 processes explained
Many organizations structure process maps in levels so readers can zoom in and out. While naming conventions vary, a common approach is to divide it into four levels:
- L1 (Level 1): Value chain / end-to-end processes – The highest level view of how the business creates value (e.g., “Order-to-Cash,” “Hire-to-Retire”).
- L2 (Level 2): Process groups – Major stages within the L1 flow (e.g., “Receive order,” “Fulfill order,” “Invoice customer”).
- L3 (Level 3): Detailed processes – The step-by-step workflow that teams execute (e.g., “Validate order details,” “Check inventory,” “Confirm delivery date”).
- L4 (Level 4): Work instructions – The “how-to” guidance, templates, screenshots, and rules that make execution consistent (e.g., “How to create a credit note in system X”). ISO calls this level ‘activities’ (as do we in Gluu). Some also refer to a level 5 where tools and systems exist.
This hierarchy matters because not everyone needs the same detail. Leaders often want L1–L2 for alignment and ownership, while frontline teams need L3–L4 for daily execution and training. When you connect the levels, your process library becomes easier to navigate and maintain.
Interested in a deep-dive on how to do this? Take our free Gluu Academy course Designing process architectures 👈
Who uses process mapping?
Process mapping is not just an exercise for external consultants. It is a shared tool, and each role reaches for it with a different question in mind:
- Business process leaders map the current state to find inefficiencies, then design the future state.
- Operations leaders standardise the same workflow across teams and sites to hold quality steady.
- IT leaders map the manual steps and system touchpoints before automating or replacing anything.
- Consultants and HR teams turn maps into onboarding paths and training material so new hires reach productivity faster.
The 5 basic process mapping symbols
You do not need all 55+ BPMN symbols to draw a useful map. In fact, showing a highly complex diagram to colleagues is the fastest way to lose them. To keep your maps self-explanatory for everyone in the organisation, start with these five process mapping symbols:
| Shape | Name | What it does |
|---|---|---|
| Horizontal lane | Swimlane (role) | Groups the activities owned by one role or department. Strictly a container rather than a symbol, but it is what makes “who does what” and every handoff visible. |
| Oval | Event (start/end) | Marks where the process begins (“Customer calls”) and ends (“Inquiry closed”). Together, the two ovals define the scope of the map. |
| Rectangle | Activity (process step) | One action someone must perform, such as “Validate order details”. Keep these action-based: verb plus object. |
| Diamond | Decision gate | A question that splits the flow, such as “Is the invoice approved?” Each exit needs a label. |
| Arrow | Flow line | Connects the shapes to show sequence and direction. |
Five shapes and a lane cover the overwhelming majority of business workflows. Add notation only when a specific audience needs it — a compliance auditor or a systems integrator, for example. As Einstein put it, everything should be made as simple as possible, but no simpler.
Types of process maps
Choosing the right map format depends on your goal. Sometimes you need speed and simplicity. Other times you need cross-functional clarity or a deeper look at waste. These are some of the most useful process mapping styles:
1) Basic flowchart (simple process map)
A basic flowchart shows steps and decision points in a clear sequence. It’s ideal for documenting a routine process quickly or creating a shared language across teams.
2) Detailed process map
This format adds more context—such as inputs, outputs, systems, documents, and exceptions. Use it when the process has many variations or when compliance and quality depend on precision.
For instance, the most widely used standard is BPMN 2.0 and it has more than 55 notations to choose from:

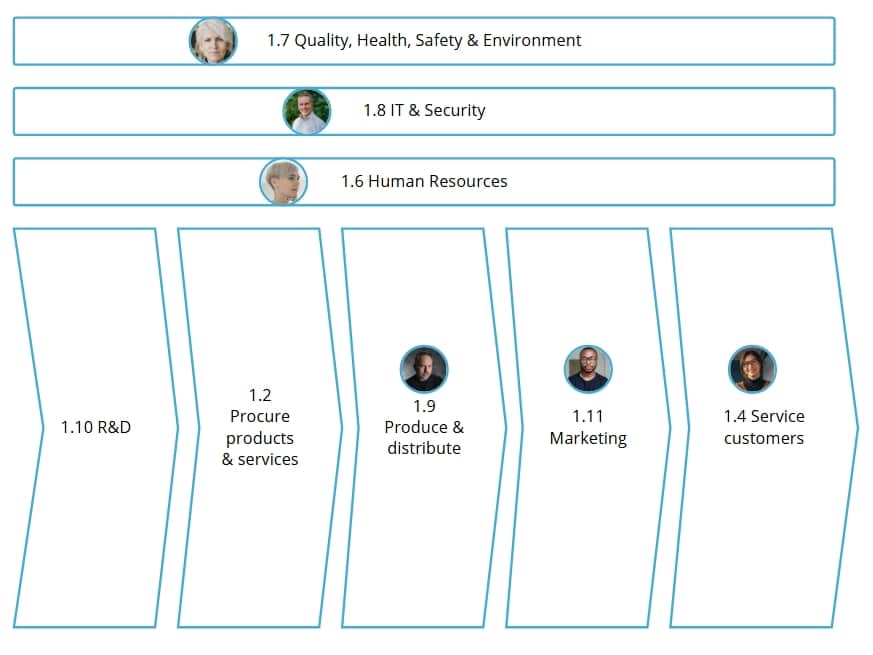
3) High-level process map (value-chain map)
A high-level map summarizes major stages without getting lost in the details. It’s useful for executive alignment, scope-setting, and defining ownership before diving deeper.
4) Swimlane (cross-functional) map
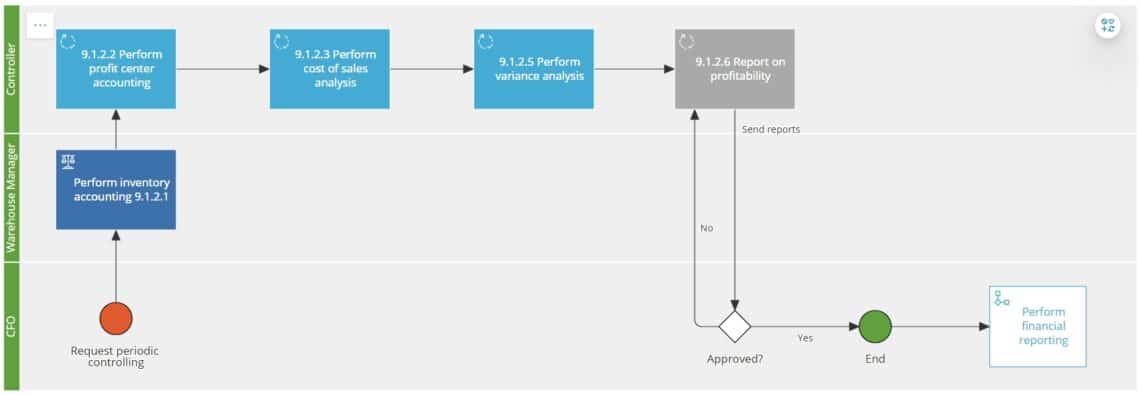
Swimlane diagrams show who does what by placing steps into lanes for roles or departments. As a result, accountability becomes obvious, and handoffs stand out immediately.
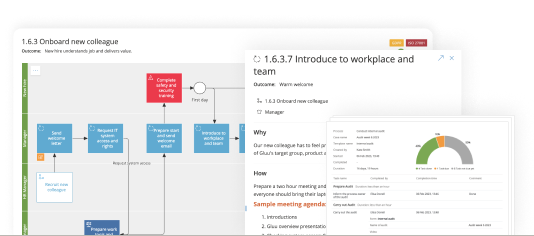
The first example above is a swimlane diagram.
5) Value stream map (VSM)
Value stream mapping focuses on time, flow, and waste. It’s especially helpful in operations and Lean initiatives where you want to measure lead time, waiting, rework, and queue sizes.
What is the difference between process mapping and value stream mapping?
Both methods visualise how work flows, so they are easy to confuse. The difference is what each one measures. Process mapping answers who does what, in what order. Value stream mapping answers where time and value are lost.
| Process mapping | Value stream mapping | |
|---|---|---|
| Primary focus | Steps, roles and handoffs — who does what | Material and information flow, and where waste sits |
| What it captures | Roles, inputs, outputs, decisions, systems | Cycle time, lead time, changeover time, uptime, waste |
| Typical audience | Frontline teams, managers, cross-functional groups | Lean practitioners, operations leaders, process engineers |
| Scope | One workflow or operational process | The end-to-end value stream, supplier to customer |
In practice, most organisations map processes first to establish standard work, then apply value stream mapping to the flows where speed and waste are the real problem. If that is your next step, our guide to lean process management covers the method in more depth.
Process mapping tools
You can create a process map in many ways—from whiteboards and sticky notes to specialized software. However, the best process mapping tools do more than draw boxes and arrows. They help teams collaborate, keep documentation current, and turn maps into interactive guides for real execution by frontline staff.
When comparing process mapping tools, look for these capabilities:
- Collaboration (comments, feedback, approvals, workshops)
- Ownership and governance (roles, responsibilities, version control)
- Linking between L1–L4 levels and related documents
- Accessibility so business users can actually find and use maps
- Consistency through templates, symbols, and standards
In practice, teams often start mapping in diagrams and then struggle to operationalize the result. That’s why collaborative approaches matter: when the people who do the work help build the map, adoption improves and updates become easier. If you want a deeper take on this approach, see why collaborative process mapping is the way forward.
Finally, remember that mapping is not the end goal. The map is a tool to improve performance over time. If your next step is optimization, you can connect mapping directly to continuous improvement practices—see this guide to process improvement for practical ways to turn insights into action.
Examples of process mapping features
BPMN 2.0 mapping
Enable full BPMN 2.0 notation to support structured, standardised process modeling and mapping.
Automatic process creation with AI
Create new process structures based on existing content using generative AI to speed up mapping.
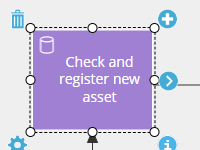
Simple process mapping
Map with five basic shapes to simplify understanding and use by employees across all levels.
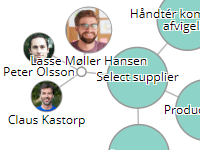
Visual process connection map
Visualize how processes and activities interconnect using filterable, clickable process maps.
Want something more in-depth? Read our guide to BPM software selection
Steps in process mapping
Different teams use different methods, but most successful efforts follow four core steps. Keep them simple, and you’ll move faster while still producing a map people trust.
Step 1: Choose the process and define the scope
Start with a clear purpose. Are you mapping to reduce cycle time, improve quality, standardize onboarding, or document compliance? Define the trigger (start) and outcome (end) so the map does not expand endlessly.
Step 2: Gather the right stakeholders and facts
Bring in the people who execute the process, plus the teams involved in handoffs. Collect real examples: forms, system screenshots, checklists, and recent cases. That way, you map reality—not a “wishful” version of it.
Step 3: Map the flow with roles, inputs, and decisions
Draft the sequence of steps and decisions. Then add the essentials: roles responsible, inputs needed, outputs produced, and systems used. If cross-functional confusion is common, choose a swimlane layout so responsibility is immediately visible.
Tip: Keep each step action-based (verb + object), such as “Validate request” or “Approve invoice.” This makes the map easier to read and improve.
Step 4: Validate, publish, and improve
Walk through the map with the team and test it against real scenarios. After that, publish it where people work—not where they forget it exists. Set a review rhythm, assign an owner, and capture feedback so the map stays useful.
Here I summarize how to draw a simple process map (old but still very popular video):
Common process mapping mistakes to avoid
Even experienced teams fall into the same three traps. Each one is easy to avoid once you can name it.
- Mapping the wish, not the reality. Teams map how they believe the process works, or how it should work, rather than what actually happens. Map the current state first, with the people who do the work, and only then design the improvement. A map of a process nobody follows is worse than no map at all.
- Overcomplicating the map. Reaching for all 55+ BPMN symbols on an everyday business workflow alienates the non-experts whose behaviour you are trying to change. Stay with swimlanes and the five basic shapes above until someone has a concrete reason to add more.
- Leaving the map unowned. A process map is a living document, not a project deliverable. Without a named process owner who reviews and updates it, the map drifts out of date, people stop trusting it, and the effort is wasted within a year.
Process mapping examples you can use in business
Examples help teams see what “good” looks like. Below are common process mapping examples that deliver fast value, along with what to include in each map.
Example 1: Streamlining approvals
Approval workflows often hide delays because work sits in queues. Map the process with decision points and escalation rules. Then focus on reducing handoffs and clarifying criteria for approval.
Request submitted
  ↓
Check completeness? ── No → Return to requester
  ↓ Yes
Route to approver
  ↓
Approve? ── No → Reject + notify
  ↓ Yes
Execute request + confirm completion
What to capture: required fields, SLA targets, who approves what, and which approvals you can automate or delegate.
Example 2: Onboarding workflows
Onboarding touches HR, IT, facilities, and the hiring manager. A swimlane map works well here because it reduces “I thought you did that” moments. Once mapped, you can standardize templates and reduce time-to-productivity.
What to capture: tasks by role, system access steps, required equipment, training milestones, and feedback checkpoints at day 7/30/90.

Example 3: Data handoffs between teams
Handoffs fail when “done” means different things to different teams. Map what data moves between steps, which system is the source of truth, and how the team handles errors. Afterward, you’ll typically find duplicate data entry or unclear validation rules.
What to capture: required data fields, validation checks, rework loops, and how the team resolves exceptions.
Example 4: Automating repetitive tasks
Automation works best when the process is already clear and stable. Map the current workflow first, then mark steps as “manual,” “semi-automated,” or “automated.” This makes automation opportunities obvious without overselling technology.
What to capture: triggers, decision rules, systems involved, and the data needed to automate safely.
Why process mapping matters
Process mapping pays off because it improves both performance and clarity. Even a “quick” map can stop recurring problems—especially when work crosses teams.
- Higher efficiency and quality because waste and rework become visible
- Clear roles and responsibilities so ownership doesn’t drift
- Faster onboarding and training with consistent L4 work instructions
- A foundation for continuous improvement by measuring and refining what matters
Most importantly, mapping creates a shared baseline. From there, you can run improvement workshops, test changes, and keep the best version of the process accessible to everyone.
Try Gluu for free
Sign up for a 30-day trial.
No credit card required.
FAQ – Process mapping
Process mapping means visualizing a workflow so you can understand how work moves from start to finish. A good process map shows steps, decision points, roles, inputs, and outputs, which helps teams improve efficiency and reduce errors.
The five basic process mapping symbols are the swimlane (a horizontal lane showing which role owns each activity), the oval (a start or end event), the rectangle (an activity or process step), the diamond (a decision gate), and the arrow (a flow line showing sequence and direction). These five cover most business workflows without the complexity of full BPMN notation.
L1 is the high-level value chain (end-to-end processes). L2 breaks L1 into major stages. L3 shows the detailed step-by-step workflow. L4 contains the work instructions, templates, and rules people use to execute the process consistently.
The four steps are: (1) define the process scope and goal, (2) involve the right stakeholders and gather facts, (3) map the flow with roles and decisions, and (4) validate, publish, and continuously improve the map.
Process mapping visualises the steps, roles and handoffs in a workflow — who does what, in what order. Value stream mapping measures material and information flow to expose waste, using metrics such as cycle time, lead time and waiting. Process mapping suits cross-functional teams standardising how work is done; value stream mapping suits Lean initiatives targeting speed and waste across an end-to-end value stream.
Common process mapping examples include approval workflows, employee onboarding, customer support ticket handling, purchase-to-pay, and data handoffs between teams. These processes benefit because mapping exposes delays, unclear responsibilities, and rework loops.
Look for collaboration features, ownership and governance, easy navigation across process levels, and a simple way to keep maps updated. Tools that support shared feedback and continuous improvement help your process maps stay relevant over time.