5 steps to visualise Gluu data in PowerBI

In this blog article we will show you a simple guide on how to retrieve all the available data in Gluu via our API and use them in PowerBI. You do not need any coding experience to succeed.
Prerequisites
You need to make sure that two things are in place prior to starting this guide:
- A Windows version of PowerBI (access to the online version is not enough)
- You need to have the “Manage account” right in Gluu.
Let’s start with a basic access
Step 1: Find the desired data in Gluu
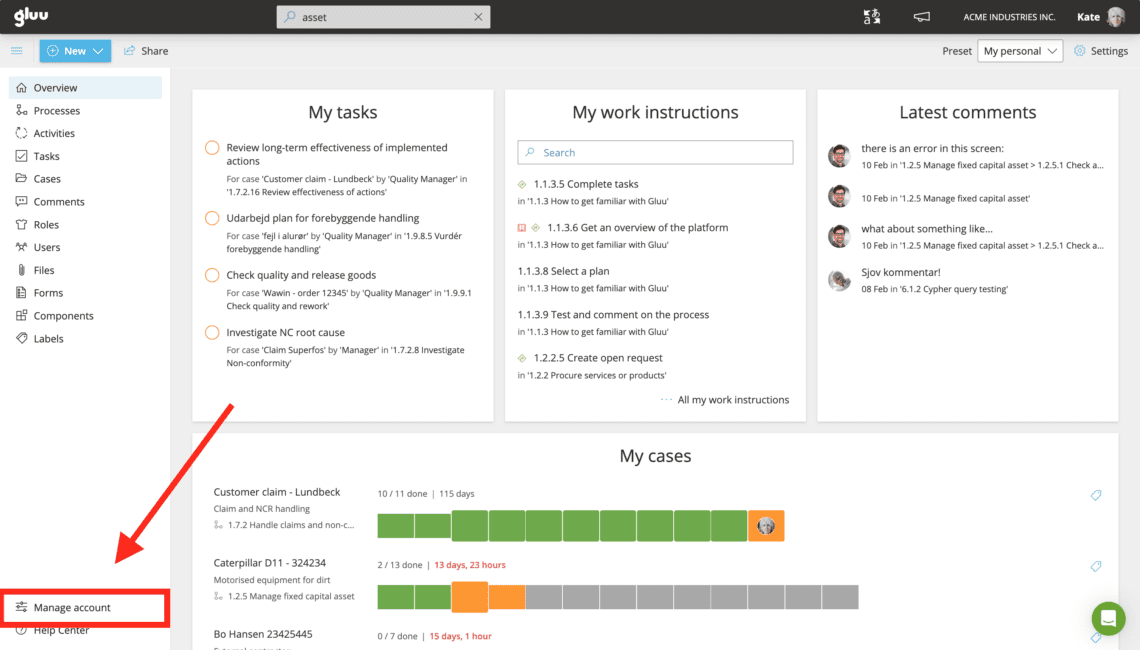
In the lower left corner of your Gluu screen you will find a “Manage account” button, that will take you to Gluu’s more advanced features.
If you do not have this button, you need to get the “Manage account” right in Gluu.
More on “Manage account” here.
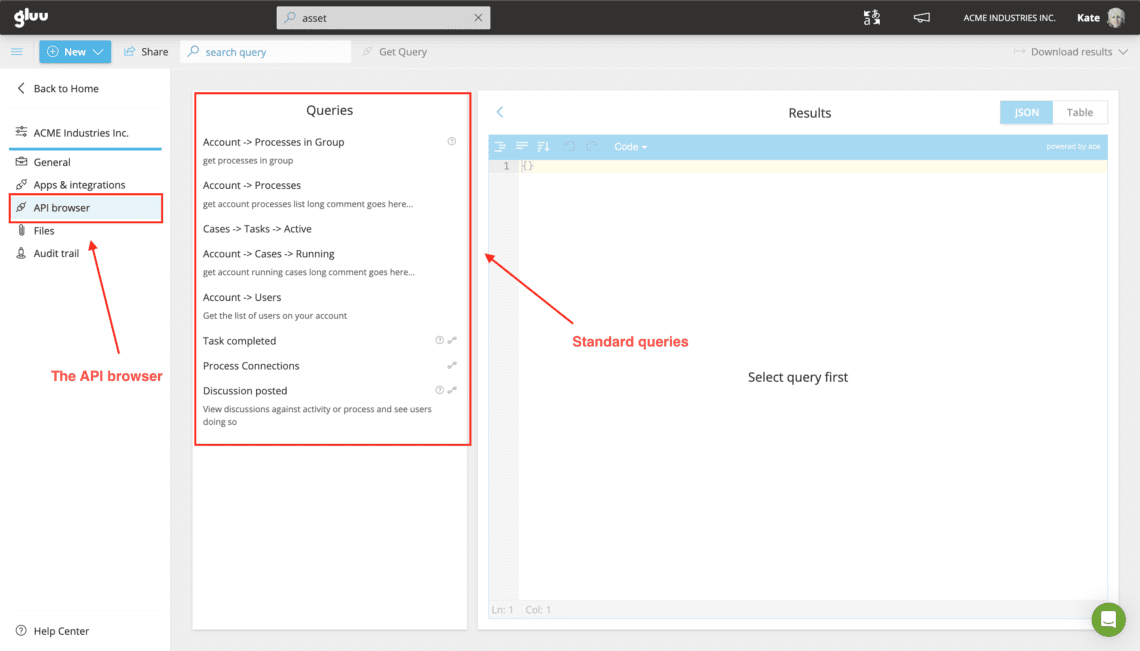
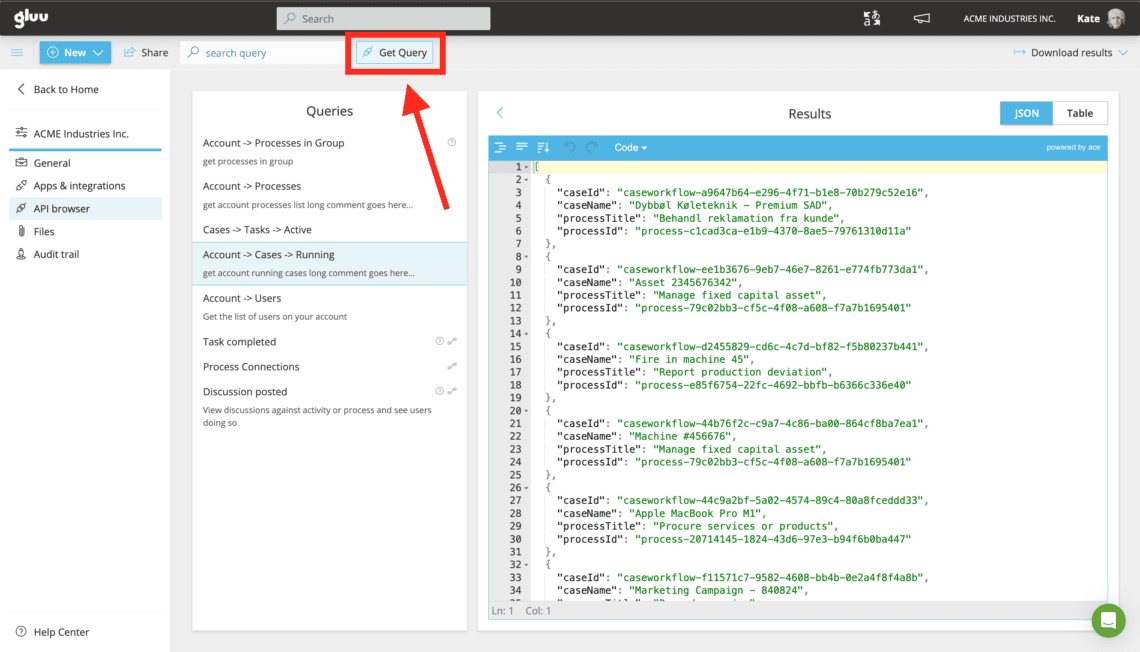
Under the menupoint “API browser“ you will find all the available queries Gluu have made available.
Please note that we will develop this area over time, so next time you visit there will probably be more queries available.
What is a query?
A “query” is basically a technical question to a server or machine. A query will be answered with the desired data in a format (in Gluu’s case JSON).
What is the output format
Gluu exports all data in the JSON format. JSON (JavaScript Object Notation) is a lightweight data-interchange format. It is easy for humans to read and write. It is easy for machines to parse and generate. Good times 🙂
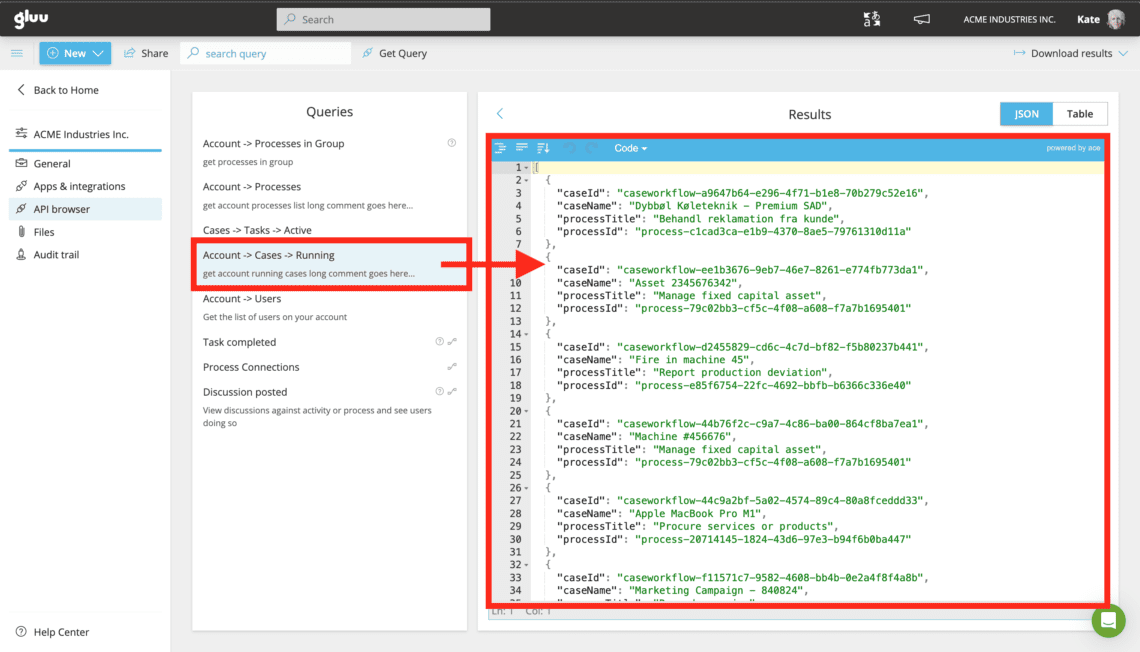
Step 2: Getting the right data
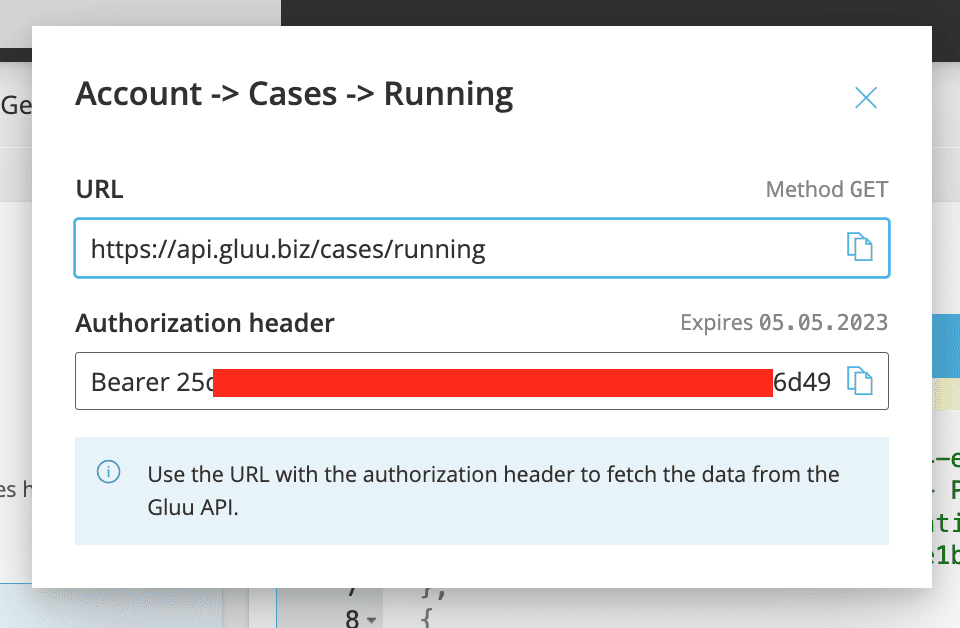
Press the “Get Query” button in the grey menubar and you will open a popup with URL and an access token.
For PowerBI to fetch the data for your current running cases you need both the URL (where to get the data) and a token (access identification).
If you need a tailormade dataset that is not available amongst the standard queries, please do not hesitate to contact the help desk.
We will create the desired query for you that delivers the exact data you need.
What is a token?
Basically a token is a long text string with letters and numbers that are really hard to guess.
Gluu uses a token for authentication to allow an application (eg. PowerBI, R or similar) to access the data. The token is also used to uniquely identify your account, so we know which data to send, which is that’s why we added the red box to the screenshot.
Please note that this token may change (mostfor security purposes), and when it does your PowerBI dashboard will no longer receive data.
Step 3: Fetching the data from PowerBI
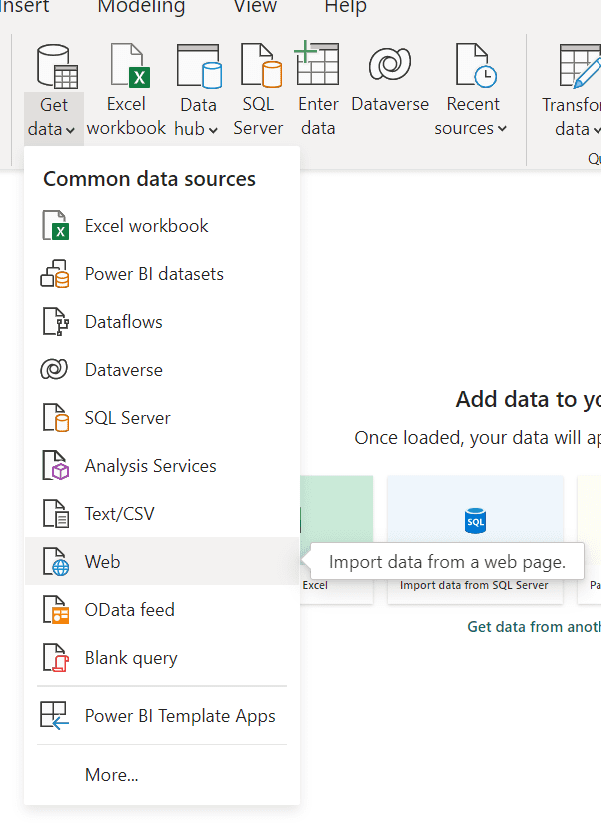
Starting with a blank dashboard in PowerBI, you press “Get data” in the top menu and chose the Web option.
If you cannot see the “Get data” is it most likely because you are in a different area than “Report”. Check in the small lefthandside menu.
In the popup chose the “Advanced” option, since you need to join a URL string in order to use the access token.
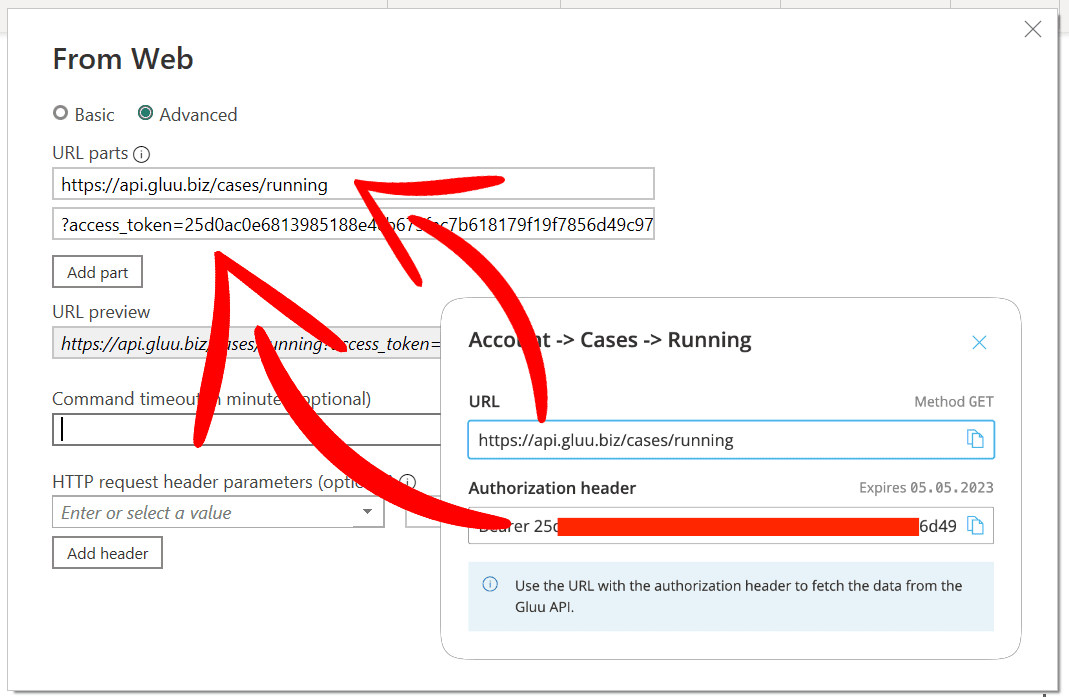
We have matched the popup in PowerBI with the popup in Gluu.
The first line in the section “URL parts” in PowerBI matches the URL line in Gluu (the popup is inserted in the image to the right).
The second line in PowerBI needs to start with
?=access_token=[access token], where you replace [access token] with the text string from the second line (Authorization header) in Gluu.
Please remember that PowerBI will add the “Bearer” string on its own when fetching data, so do not copy that word.
Check the “URL preview” in PowerBI prior to pressing the “OK” button.
It should read something along the lines of:
https://api.gluu.biz/cases/running?access_token=25dbokasfda
,where the akward string “25dbokasfda” is replaced by yours.
Everything OK? Great 🙂
Press the “OK” button (and wait…)
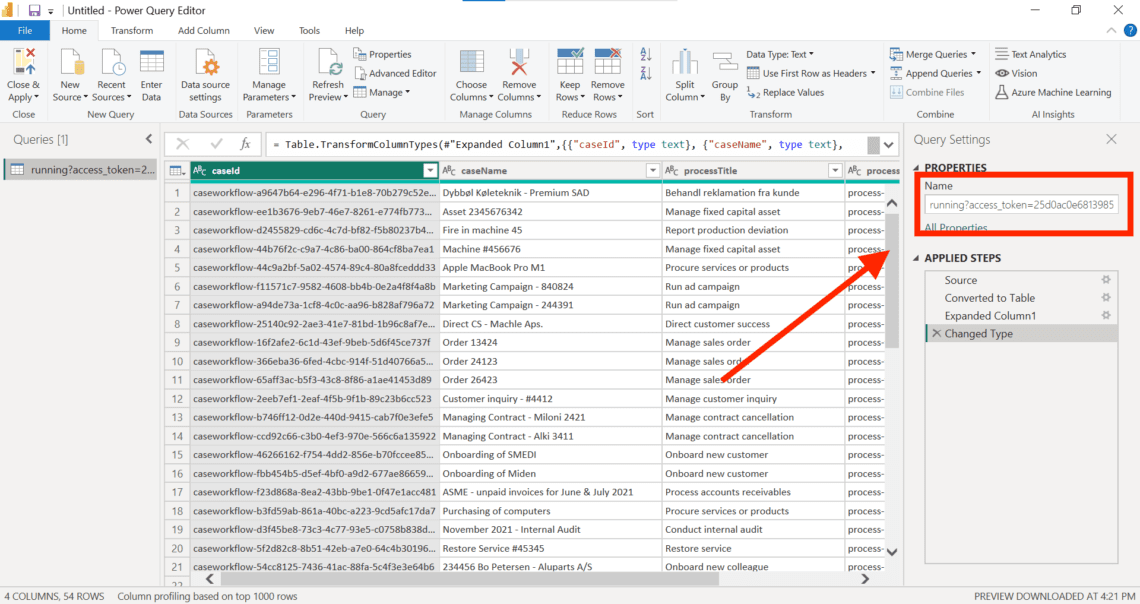
Step 4: The Power Query Editor
Please note that PowerBI opened a new window with the Power Query Editor .
In this window you can see the data fetched from Gluu in a table view.
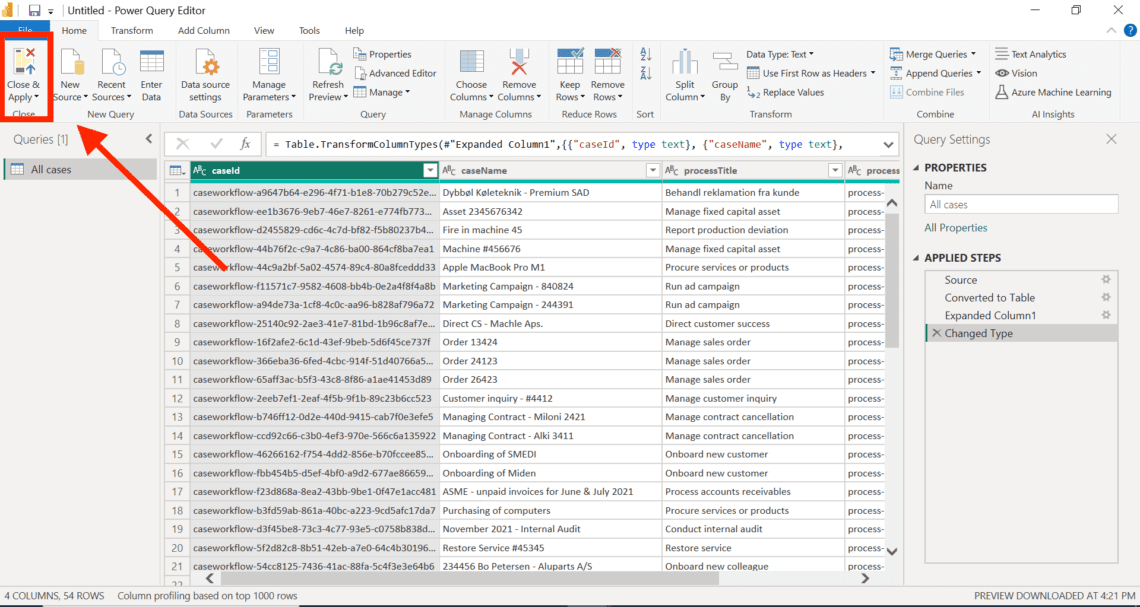
For the sake of simplicity and your own sanity, change the name of your Gluu query to “All cases” under Properties in the right side of the screen. It will make it a lot easier to identify later on.
Once you have renamed the query press the “Close & Apply” button to return to PowerBI.
Congratulations! You have now successfully imported Gluu data in PowerBI.
If you want to visualise it too, see step 5.
Step 5: Visualising the data
Back in PowerBI you now have the Gluu data available. You can see it by pressing the “Data” button to the left or join the data with other Gluu or other organisational data in the “Model” section.
Please note: You might need to press the “Apply changes” in the yellow bar in the PowerBI interface.
Let’s start by visualising the “All cases” data:
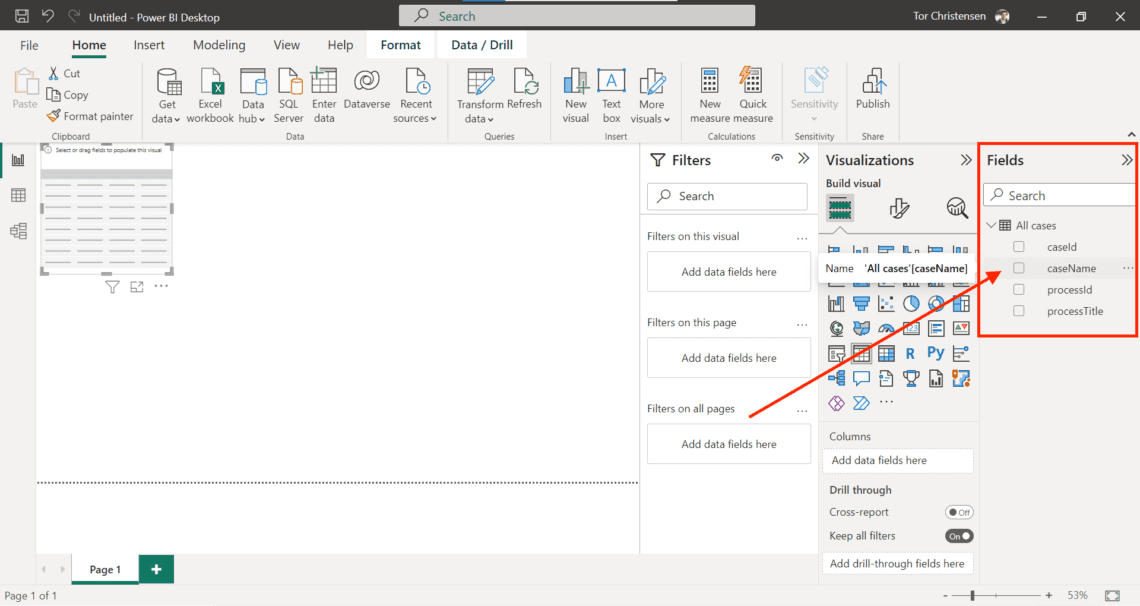
- Press “Report” in the lefthand side menu
- Chose the “Table” in the Visualization pane to the right
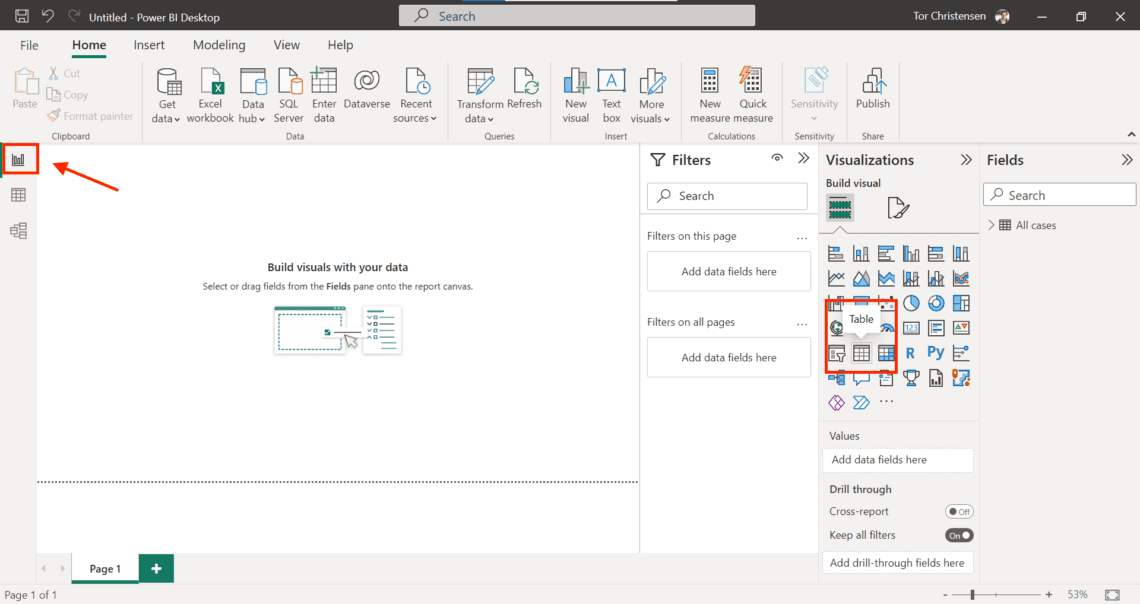
Once you have a table icon on the report area (see image), open the “All cases” dataset in the Fields pane and check the “caseName” field.
You have now listed all active Gluu cases in PowerBI.