Goal: Learn the editor layout, add and connect shapes, and use key toolbar options to produce clean, compliant maps.
This article is about the basics of editing process maps with Gluu’s Process Editor. Go to our simple guide, if you’re looking for general information on process mapping.
New to processes? Take the free Gluu Academy video course “Common process understanding.”
Overview #
The editor includes the 1) diagram area, 2) the toolbar and 3) a mini-map for large diagrams.

Basic editing #
If you want to edit a process diagram, you first have to turn on edit mode by clicking the toggler in the top right corner. You will see the toggler if you have process editing rights.

When edit mode is turned on, you can add new objects or rearrange existing objects.
If you want to add an object to the diagramme, you can drag and drop any of the 6 shapes on the far right of the toolbar to the diagramme area.

Once you have positioned the shape, the options menu is automatically shown, but you can always open (or close) it manually by doble-clicking a shape. Different objects have different setting options, see more about specific object options below.

Activity types #
In ‘Manage account‘ admin users can enable or disable ‘activity types’. Each activity type has its own color and icon across Gluu. Users can also filter on activity types.
Activity types are used to visually show the primary logic in an activity:
- Default – the blue box that is used for any activity (that has work instruction content).
- System – used if the activity is done in a system, or by and AI agent.
- Control – used if the activity is a business control used for compliance.
- Risk – used if the activity is part of a risk register.
- Customer Touch Point – used if activity touches the customer.
The account owner should decide which activities that are enabled and used. This includes your organisation’s internal usage policy.
Note that you can use labels in combination with activity types. E.g. you can use the type ‘System’ to highlight all system-based activities and then label with a regulatory standard.
You can also use components in combination with activitypes. E.g. your type ‘System’ can have components inside the work instruction to highlight the specific system in use, e.g. Business Central.
Working with objects or shapes #
If you want to delete an object, you simply click the bin in the top left corner and if you wish to connect it to another object, you can grab and drag the arrow on the center right of any object.
When you drag an arrow to another object, make sure you see an orange square around it. That is you cue that they are connected and the arrow will the follow the object and align itself to it, if you move it.

All objects must be placed inside a swimlane and cannot overlap other objects. If so, the process diagramme cannot be saved and a red square will appear to highlight the problematic object.

If you want more information about what is wrong with the object placement, you can click the warning triangle that appears as the first shape in the toolbar, when objects are not placed correctly.

TIP! Gluu auto-saves your process diagramme as you are working on it.
Now that we have the basics down, lets take a closer look at the different options in the toolbar.
The editor’s toolbar #
When you edit, the toolbar will have the following options available:

We will go through them left-to-right below.
Roles (T-shirt icon) #
Use![]() to customize, align and/or rearrange roles/swimlanes
to customize, align and/or rearrange roles/swimlanes

This tool is useful if you want to:
- align “out-of-place” swimlanes. If you have swimlanes that are shorter/longer than the others or accidently moved out of place, you just click the t-shirt and then apply. All other swimlanes will automatically be centered and adjusted to the same length.
- rearrange the order of the swimlanes. You can drag and drop the swimlanes to reposition them. All shapes are automatically moved with the swimlane to the new position.
- add a swimlane in the middle of your diagramme. Click add, drag the swimlane to the desired position and click apply.
Zoom, re-do and un-do #
The three zoom options are pretty straightforward and will zoom in, zoom out and go back to normal view. Zoom to fit will give you a view of the full process in one screen.
Re-do and un-do will let you un-do an action or re-do it.
Align shapes #
If multiple shapes are selected, you can use this feature to align them according to each other.

Connector layout and behavior #
The gear![]() opens a settings menu for the layout and behavior of your arrows and the option to delete all custom bends (waypoints) added to the process diagramme:
opens a settings menu for the layout and behavior of your arrows and the option to delete all custom bends (waypoints) added to the process diagramme:

When you choose the “Smart” option, the diagram automatically chooses a route between objects including bends/vertices. If you choose the “Straight” option, you get an arrow and if you choose “Jump-over” the arrows create a little bridge when they intersect, making it easier to see which direction the individual arrow is going.
TIP! If you are not happy with the automatically chosen route of an arrow, you can always manually adjust it afterwards.
BPMN 2.0 switcher #
The toggler is available if you have it enabled in your account settings as optional and it turns on all the BPMN 2.0 shapes:

Gluu standard notation shapes #
Finally we have the 6 shapes  available in the Gluu standard notation. They are based on BPMN 2.0’s basic level and useful if you want to create flows for business users.
The 6 shapes are:
- Swimlane
- Activity
- Process
- Decision gate
- Event
- Text box
Below we’ll summarize the less obvious shapes:
Decision gates #
They are used to indicate that the process flow breaks into two or more possible paths depending on the decision made.
It is good practice to write the question you want the user to answer in the decision gate text and then let the arrows going from the decision gate be dotted lines as opposed to solid to indicate to the person looking at the process that this is not a set flow in the process, only an optional one.
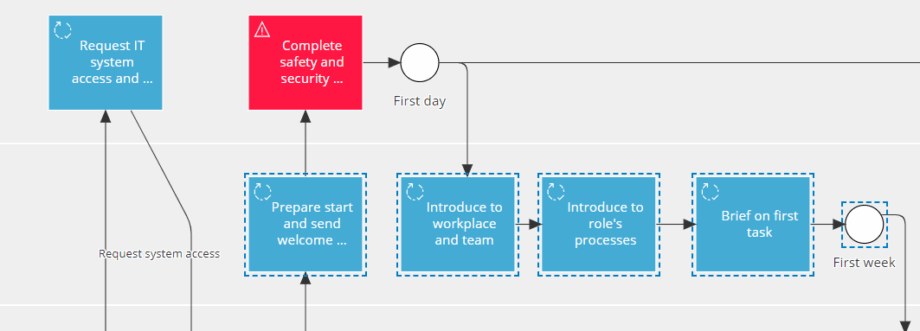
Events #
There are 3 different types of events:
- Start
- Intermediate
- End
Start events show what starts the process or what other process’ output becomes the input for the current process.
End events show the goal that is achieved when the process or which process the current process’ output becomes the input to.
You are actually able to add links to the events to other processes. Using an HR example of when this could make sense, the Onboarding process would be started by the Hiring process and end with the Training or Offboarding process.
Intermediate events are used to show parts of a process flow that do not require an activity with a work instruction but are important enough still that they need to show in the flow. It can be something done by a customer that needs to happen before the next activity in a process can happen for instance.
Text box #
The text box is an option to add more information to a process diagram to help guide the user. We do, however, recommend that you use it sparingly, because if a text box is needed it is usually a sign that your process is too complicated to understand without the extra guidance and you should consider if it is better to revise the diagram and make it more user friendly rather than using the text box.
Tips and tricks #
Adjust arrows #
Having trouble getting the arrow to connect to an abject where you want it? Try clicking on an arrow and then moving the little black dot that appears. The dot is the point in the object the arrow aims for.

Remove vertices #
Double-click on a connection vertex (custom bend) to remove it.

Reposition arrow descriptions #
You can reposition the text for an arrow line by grabbing the text and dragging it to the desired position.

Select multiple objects #
Shift + left mouse click (hold) will change your cursor from a hand to a plus sign and you can then drag a square around the objects you want to select and move them all at once.
Alternatively you can press and hold ctrl and then use your mouse to click on shapes to select them.


